Facing Facts: Charter Schools in Texas
The quantitative research behind a 2025 report on Texas charter-school spending, staffing, and oversight.
I did all the quantitative research and analysis for Facing Facts, a report published by Our Schools Our Democracy in February 2025 through my work at Data for Public Education.
I assembled and matched the source records, checked fiscal totals, and kept a record of where the numbers came from. During review, I also caught incorrect units and estimates that needed to be labeled as estimates.
The report compares charter schools and school districts on spending, staffing, and other measures. My contribution was the data and analysis; the report’s writing, design, and publication were a broader team effort.
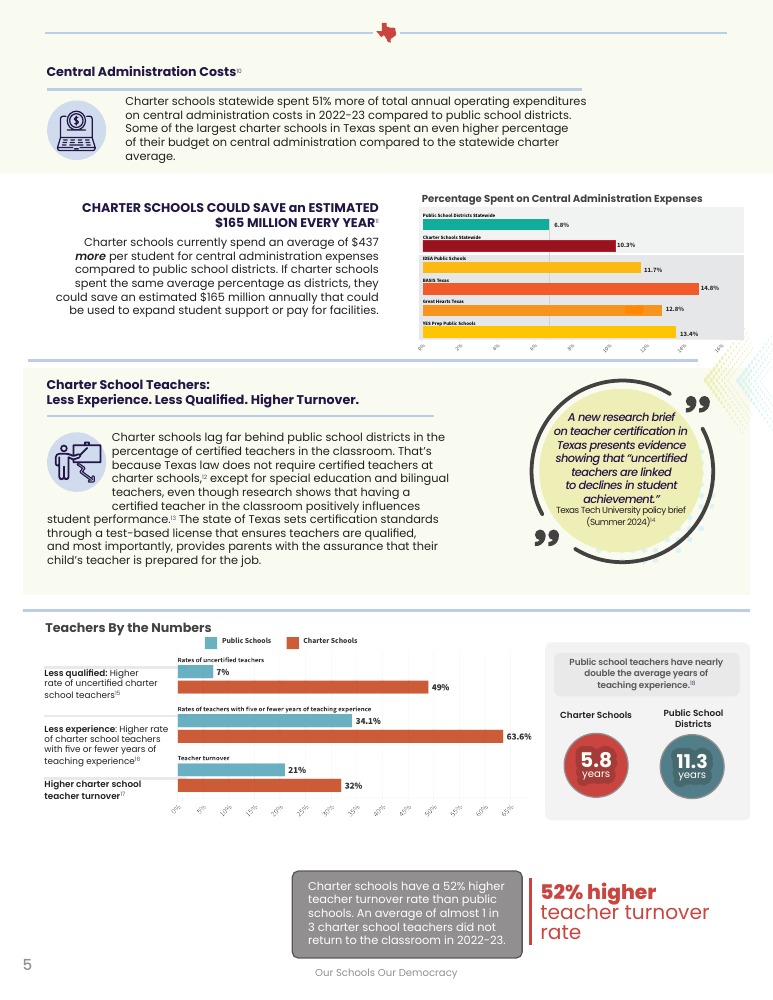
The figure below reproduces one comparison from page 5. It shows the share of operating expenditures spent on central administration, using 2022–23 data.
TEA Snapshot 2023 · 2021–22 financial data
Central administration’s share of spending
One of the report’s comparisons: the share of total annual operating expenditures spent on central administration.
Statewide aggregates from Facing Facts, February 2025. These are expenditure shares, not per-student amounts. The report documents its TEA sources and methods in the notes.
Reading one comparison
Using the rounded values printed in the report, 10.3% − 6.8% = 3.5 percentage points. Dividing that gap by the district share gives about 51% more of the operating budget devoted to central administration. That does not mean 51% more spending per student.
I checked this comparison against TEA’s Snapshot 2023 district file. Weighting each reported central-administration percentage by its operating expenditures produces approximately 6.83% for districts and 10.29% for charters, which round to the published figures. The calculation uses 1,020 district and 184 charter records with usable financial values; five other records have missing values.
A date clarification: the original report labels this comparison 2022–23. TEA’s data dictionary dates Snapshot 2023’s financial fields to 2021–22. This exhibit uses the source’s financial year. The reconstruction is approximate because TEA rounds each entity’s percentage.